
Ormond Beach, FL RainDrop Report
See MoreYTD Rainfall Totals in Ormond Beach, FL
10.25″ so far this year. (14.37″ ytd average)
2026 YTD10.25″
YTD Avg14.37″
Daily Rainfall Totals in Ormond Beach, FL
Today's and yesterday's rain totals
5/26/20260.00″
5/25/20260.00″
Monthly Rainfall Totals in Ormond Beach, FL
Last 4 months accumulated rain totals
Feb.1.42″
Mar.1.60″
Apr.2.22″
May.4.48″
Looking for detailed historical and forecasted rain totals for any location?
Tap here to download the RainDrop app today!With RainDrop
🌧️No rain gauge needed to track rainfall
🚗No more wasted gas or time driving around checking locations
🔔Never miss when rain starts
📊See if you're above or below average for the year
🌥️Plan ahead without uncertainty
📅We automatically track every rain event for you
Download Free Today
Scan or tap the QR code below to download the app

View Live Radar
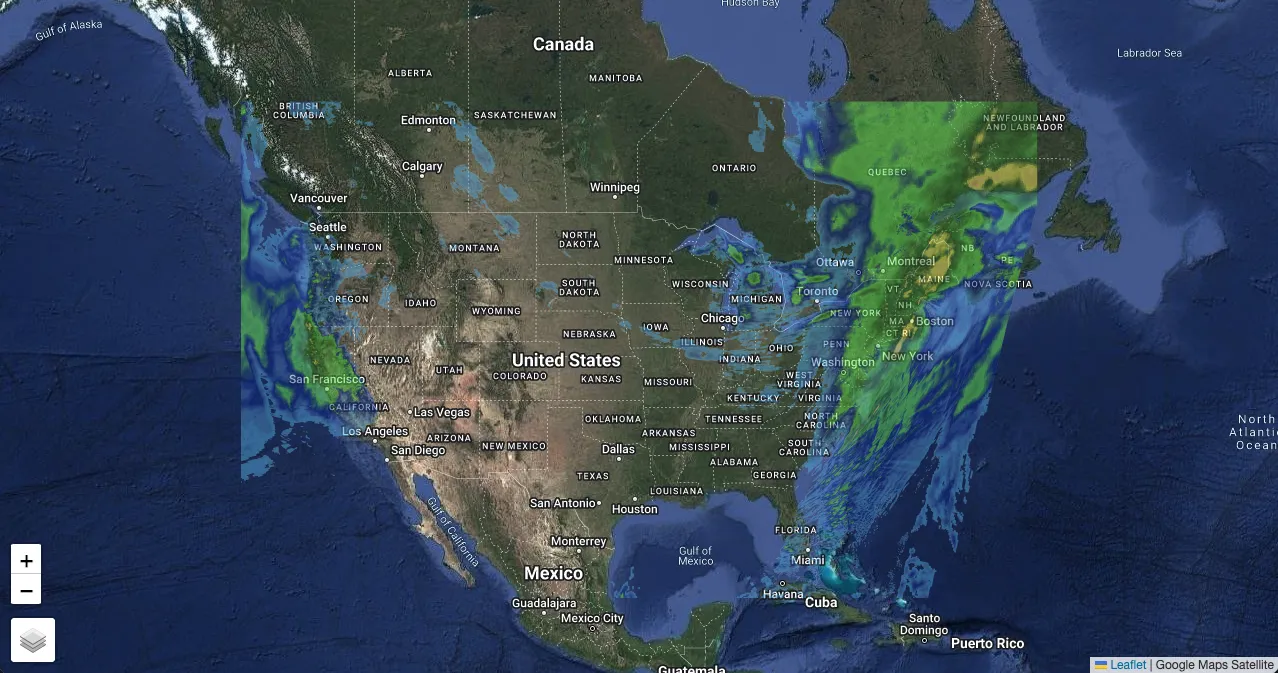
View Live Radar
View Snowfall Totals

View Snowfall Totals