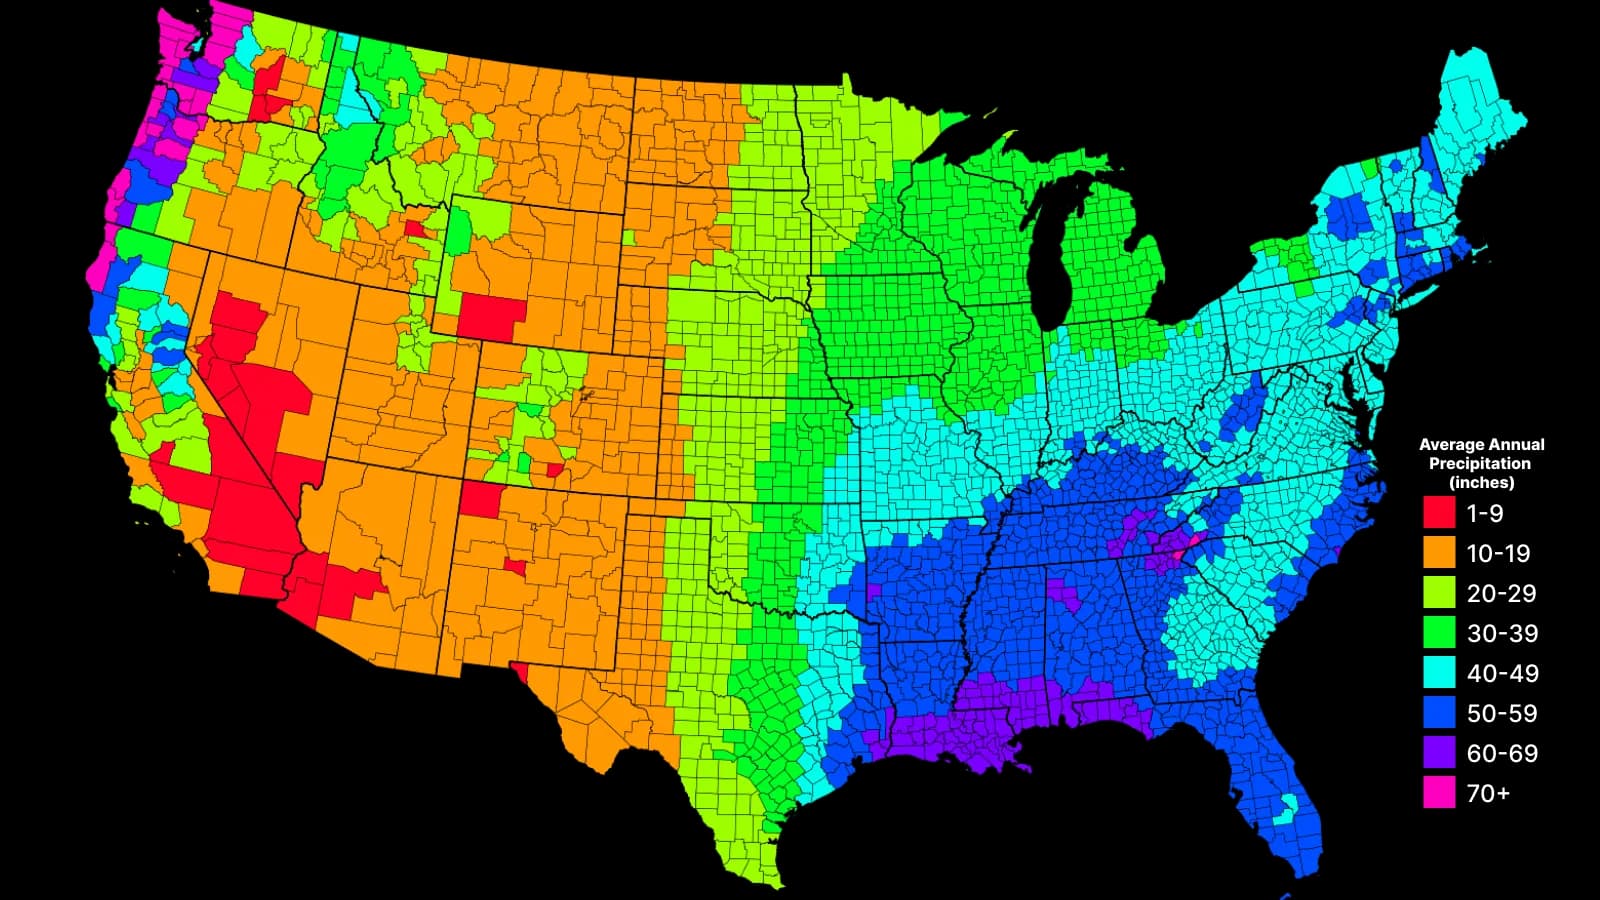
View Your County's Annual Precipitation Average
Discover how much rainfall, snowfall, hail, and sleet your county gets on average in a year! This map shows annual precipitation totals by zip code covering all counties in the 48 contiguous states.
Posted by
Related reading
Total Precipitation Averages For May
Discover how much precipiation falls on average in May! This map shows May's precipitation totals for the United States.
Best Rain Gauge App For Farmers in 2024
Learn why RainDrop is the best rain gauge app for farmers seeking rainfall measurements for each of their fields without the hassle of physical gauges.
Total Precipitation Averages For April
Discover how much precipiation falls on average in April! This map shows April's precipitation totals for the United States.
What Is Annual Precipitation?
In simple terms, annual precipitation refers to the total amount of moisture that falls from the sky over a year, including rain, snow, sleet, and hail. This map provides a clear view of the average annual total amount that typically falls, measured in inches. Snowfall is converted into its rainfall equivalent.
Data Source and Processing
The data utilized in this map is derived from the PRISM available at prism.oregonstate.edu. The PRISM model is known for providing high spatial resolution climate data. This map covers the period from 1991 to 2020 in a 4x4km resolution. To adapt this detailed data for our map, we have processed it to calculate the average annual precipitation across each county. This involves aggregating the high-resolution data from PRISM to obtain an county-wide average.
Wanna know how much it rained for your location?

